During the last year, the Keystone pipeline project has drawn the spotlight from
environmentalists, politicians and the media. The proposed 1,897-km (1,179-mile)
pipeline will be constructed by TransCanada to transport oil from Hardisty,
Alberta, to Steele City, Neb. While the route has often been a point of
conflict, the biggest issue for environmentalists has been the role the pipeline
will play in allowing Canada to continue developing what some opponents call
"the world's largest and most devastating environmental and industrial
project."1 The Keystone pipeline will be a critical output avenue that enables
production of Canadian Oil Sands to continue to increase.
The sheer amount of attention garnered by the Keystone project makes it all the
more surprising that, by comparison, construction of Liquefied Natural Gas (LNG)
export terminals in the United States are flying under the radar. With five
applications in to the Federal Energy Regulatory Commission (FERC) and at least
another six U.S. projects on the drawing board, the potential construction of
export facilities will have a dramatic impact on the scale of natural gas
drilling and the extent to which fracking operations are expanded in communities
across the United States. The Obama administration has yet to comment on the
applications, however, it is not known if this is because they will side with
the naysayers or those in favor of development.
Roadblocks to construction
While economic considerations may impact the number of export terminals
ultimately built in North America, the primary roadblock is political. The
drastic imbalance in global natural gas prices will likely override other
economic risks (i.e. construction risk and competitive risks from other natural
gas exporters) if somehow political risks are removed. The chart below depicts
LNG "landed prices," which are the prices received at the terminal where
regasification occurs.
World LNG Est. 05/2012 Landed Prices
| Lake Charles, LA |
$1.78 |
| UK |
$9.17 |
| Spain |
$11.50 |
| India |
$13.65 |
| Japan |
$16.65 |
Source: FERC
The critical link between export terminals and the future of the natural gas
industry
With natural gas prices at record lows of less than $2.50 per Mcf (thousand
cubic feet), producer economics are either supported by liquids or they could
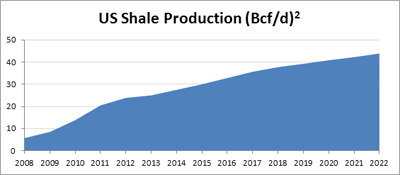
find themselves struggling to survive. Production from U.S. shale plays has
increased supply by roughly 18 billion cubic feet per day (Bcf/d) during the
last five years and is projected to increase supply by another 20 Bcf/d during
the next 10 years. The only serious constraint to additional supply appears to
be low prices (although resistance against fracking will likely be monitored).
While growth is projected in traditional demand segments, the mid- to long-term
direction of natural gas prices is likely to be more profoundly impacted by the
decisions surrounding LNG export terminals. No other demand segment has the same
unpredictability or the potential to reach the same level of additional demand.
By 2022, research and consulting firm Wood Mackenzie is forecasting more than
nine Bcf/d in demand growth in traditional sectors while the capacity of
currently proposed and potential export sites represents twice that amount in
possible new demand. (See chart below)
Demand Growth (Bcf/d)3
| |
Residential |
Commercil |
Industrial |
Power |
LNG Exports |
| 2012 |
12.2 |
8.4 |
18.6 |
23.4 |
0.0 |
| 2022 |
14.3 |
10.7 |
22.7 |
25.9 |
0 - 18 |
| Growth |
2.1 |
2.3 |
4.1 |
2.6 |
0 -18 |
Proposed and Potential North American Export Sites (Bcf/d)4
| Sites Proposed to FERC |
Potential U.S. Sites |
Proposed & Potential
Canadian Sites |
|
|
Cove Point, MD |
1.0 |
|
|
| Freeport, TX |
1.8 |
Brownsville, TX |
2.8 |
|
|
| Corpus Christi, TX |
1.8 |
Astoria, OR |
1.3 |
|
|
| CoosBay, OR |
0.9 |
Pascagoula, MS |
1.5 |
Kitimat, BC |
0.7 |
| Lake Charles, LA |
2.4 |
Lavaca Bay, TX |
0.4 |
Douglas Island, BC |
0.3 |
| Hackberry, LA |
1.7 |
Elba Island, GA |
0.5 |
Prince Rupert Island, BC |
1.0 |
| Subtotal |
8.6 |
Subtotal |
7.5 |
Subtotal |
2.0 |
| Grand Total |
18.0 |
|
|
The politics of export facilities
U.S. export facilities require approval from the U.S. Department of Energy (DOE).
These approvals cover two categories: 1) terminals requesting export
approval to Free-Trade Agreement (FTA) countries and 2) terminals requesting
export approval to World Trade Organization (WTO) countries. FTA country
approvals should be granted much more expeditiously, but only one FTA country is
a major LNG importer (South Korea).
On Feb. 16th, Energy Secretary Steven Chu stated that no new
applications for LNG exports to non-FTA countries would be approved by the DOE
until they had made a final determination as to whether exports were in the
public interest. In pursuit of this question, the DOE commissioned two
studies.
- The EIA delivered the first study, “Effect of Increased Natural Gas Exports on
Domestic Energy Markets,” in January.3 It concluded that “increased
natural gas exports lead to higher domestic natural gas prices, increased
domestic natural gas production, reduced domestic natural gas consumption and
increased natural gas imports from Canada via pipeline.”5
- The second report is being completed by a third-party and will explore the
“broader economic effects of increased natural gas exports.”6 The
report was expected to be completed by April, but in March the DOE announced
that it would not be available until the end of the summer.
Whether debate on this issue heats up before or after the election, it should
prove interesting. Advocates will argue that export capacity will improve
our trade balance, create jobs and provide much needed revenue to states.
Opponents will argue that selling energy resources does not align with our
energy independence goals and will counter with the argument that exports will
jeopardize our increased reliance on natural gas in the industrial and power
sectors. Fracking opponents may find alliances with other opponents
of natural gas exports.
Wood Mackenzie and several other forecasters are calling for a modest recovery
of prices during the next five years. While it is doubtful export capacity
will be built to the tune of 18 Bcf/d, Wood Mackenzie forecasted that nearly
seven Bcf/d of North American export capacity be built by 20227.
Yet forecasters always find political predictions to be problematic. If the
actual over/under turns out to be wildly different from their forecasted seven
Bcf/d, expect something other than a modest recovery of prices to occur.
1 Garth Lenz: The True Cost of Oil (Ted.com)
2 North American Gas Long-Term View: Spring 2012
3 North American Gas Long-Term View: Spring 2012
4 Department of Energy, Office of Energy Projects
5
http://www.eia.gov/analysis/requests/fe/pdf/fe_lng.pdf
6 SNL Energy:
http://www1.snl.com/InteractiveX/article.aspx?ID=14510861
7 North American Gas Long-Term View: Spring 2012
Return to top >>
|